Scattered complaints
Reports arrive across channels without consistent structure, making triage and prioritization harder than it should be.
AI-powered civic reporting
Civik helps citizens report issues in seconds and gives administrations a unified view of clusters, aging, fix rate, and issue trends across the city.
Group repeat complaints by place and issue type so teams work from hotspots, not scattered tickets.
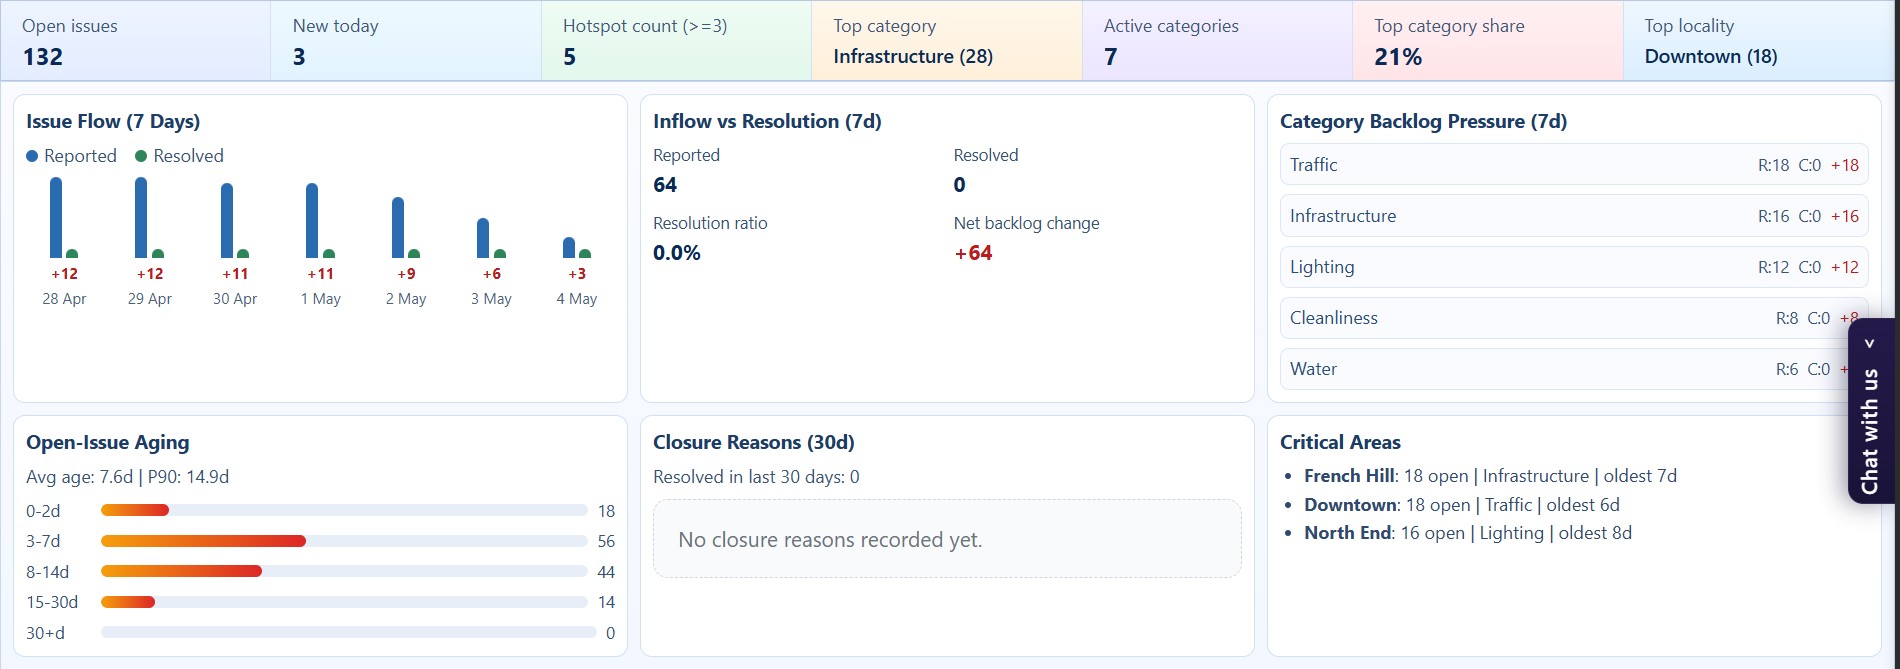
Track aging, issue volume, top categories, and resolution movement from one dashboard.
Move from raw citizen reports to a structured operating picture that city officials can actually use.
Citizens send reports in different formats, operations teams lose the geographic context, and leadership has no simple way to see where problems are building up.
Reports arrive across channels without consistent structure, making triage and prioritization harder than it should be.
Without cluster-level visibility, city teams struggle to see which neighborhoods and issue types need attention first.
Ageing, fix rate, and repeated issue patterns are difficult to monitor when the reporting system stops at ticket collection.
How Civik works
Civik keeps the citizen flow simple while transforming incoming reports into useful city intelligence for administrators and field teams.
The mobile app captures the issue image and location so the report starts with reliable context.
AI helps suggest issue details from the image, reducing typing and improving data quality.
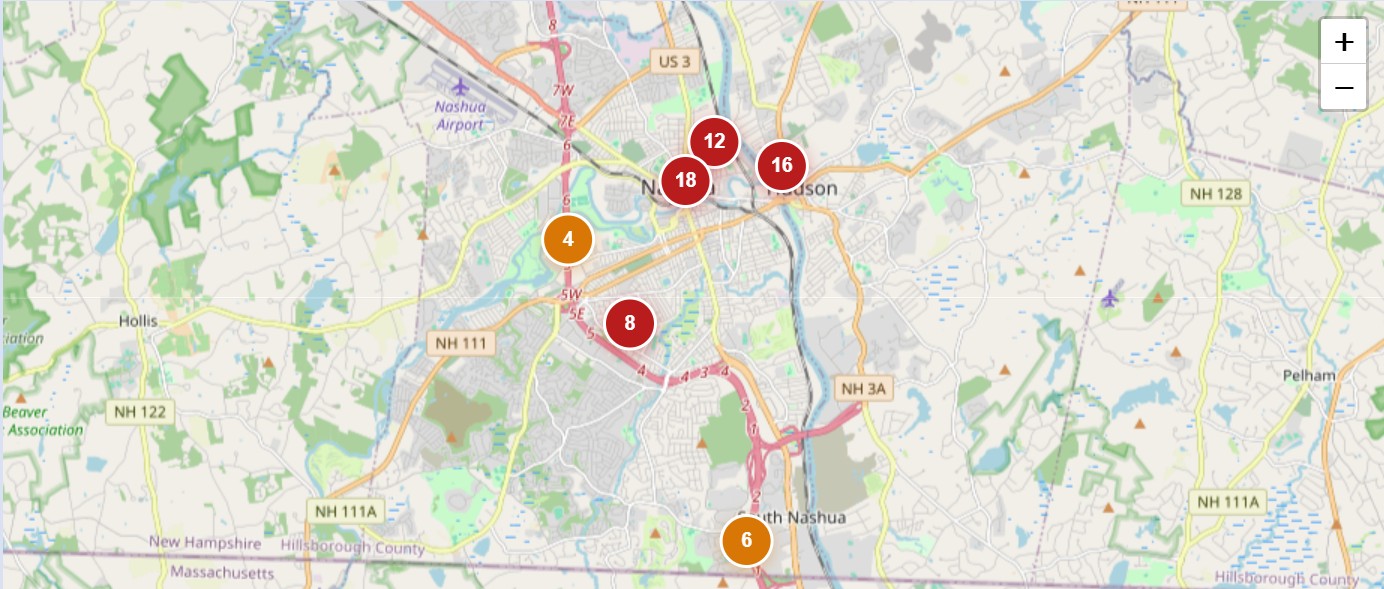
Similar issues are grouped using issue type, geography, and image-informed similarity to reveal hotspots.
Admins can review clusters, trends, aging, and operational summaries in one place instead of chasing fragmented reports.
Platform views
The landing page now uses the actual dashboard captures you added, so the story matches what city teams will really see in the product.
Platform features
Citizens can report faster using a photo-first flow with assisted issue details and less manual entry.
Related issues are grouped by type, location, and similarity so teams can work from problem zones instead of duplicates.
Track issue volume, report ageing, fix rate, and repeated problem areas from a single admin view.
Geo-fenced reports can be routed to the correct city workspace so the right team sees the issue immediately.
Summaries help teams quickly understand what is being reported, how often, and where the concentration is growing.
Give officials one place to monitor, review, prioritize, and act without stitching together multiple tools.
For cities
Civik helps administrations move beyond collecting reports. It creates a structured operating view of what citizens are seeing, where issues are repeating, and how resolution performance is changing over time.
Citizen experience
The citizen opens Civik within the supported city area and starts a report without navigating a long form.
The user uploads a photo of a pothole, drainage issue, garbage pile, broken signal, or other civic problem.
AI-assisted details and captured location help send a cleaner, more actionable report to the right city workspace.
FAQ
Give citizens a simple way to report issues and give administrators the visibility they need to respond faster and plan better.